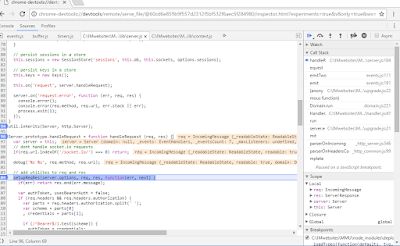
Chrome browser supports great ways to debug, break points, watch and more the same way you do inspecting the browser javascript.
1. Fast Debugging: User node --inspect filename (Devtool GUI)
> node --inspect myserver.js
This will give you a link to a devtool session some thing looks like below
chrome-devtools://devtools/remote/serve_file/@60cd6e859b9f557d2312f5bf532f6aec5f284980/inspector.html?experiments=true&v8only=true&ws=127.0.0.1:9229/cd33
a427-37a4-4d96-b3f6-13ed4cbc870f
Server is listening on port: 2403

you just copy this and paste in a new tab in chrome browser , It opens up the devtool. (this is only debugging window. It doesn't start your application)
Now you open a browser window or what ever ways you want to access your application , make the first call.
You can use F8 (Run) , F10 (skip) , F11 (step into) keys on Windows to step through the code.
Note: Some times the devtool session hangs in the memory somewhere. So , restart and you will get a new link with new session id.
*** Make sure Chrome devtool -> settings debugger is not disabled (checked)
Debugger
DevTools
2. Use Devtool npm package. (That again launches Chrome Devtool Console UI)
> npm install devtool -g
Then,
> devtool server.js - This launches the Chrome Devtool console.
3. Inbuilt in NodeJS : 'debug' argument
> node debug server.js
This is very manual - for example,
To add and stop at a break point you have to add 'debugger' statement inside your source code! (I know you don't want to. )
4. Visual Code
Comments
Post a Comment